
About Back-Scattering Interferometry technology
Back Scattering Interferometry (BSI) is a label-free, free-solution technology that employs novel, conformation-sensitive detection to characterize complex drug targets — small molecule interactions in a native-like environment. BSI has significant advantages over conventional methods for membrane preparations and other complex protein targets including allosteric target-compound direct binding assays with radiolabel sensitivity.
Back-Scattering Interferometry (BSI) is a free-solution, label-free molecular interaction assay technology that is based upon a highly sensitive micro-scale interferometer (see figure to right). At the heart of the interferometer is a microfluidic chip which receives samples for analysis.
BSI molecular binding measurements are performed on mixtures of target and ligand (or drug target and lead compound) that have been incubated to achieve equilibrium. Both target and ligand have their own specific refractive index signature, which is measured as the mean polarizability of the sample as probed in the microfluidic channel. When ligand and target bind, they create a new and unique species, which translates as a discernable change in measured refractive index. Upon binding many targets undergo conformational change, which serves as the primary origin of the BSI signal.
Binding assays are established to achieve target saturation without ligand depletion. Hence assays typically employ a sparing amount of target in the presence of excess ligand. Following incubation,
samples are read in the BSI instrument, and binding maximum and
associated equilibrium dissociation constant are derived.
Select the tabs below to delve deeper into the BSI technology story.
History of BSI Technology
Back-Scattering Interferometry (BSI) was invented by Professor Darryl J. Bornhop of Vanderbilt University in the 1990’s, and was first used as a highly sensitive refractive index detector for micro-separation techniques such as capillary liquid chromatography (1) and capillary electrophoresis (2 and 3). Dr. Bornhop then began to apply BSI technology to the study of molecular interactions during his tenure at Texas Tech University as well as with his group at Vanderbilt University. During this period, he looked at the interaction of various ligands to immobilized protein targets (4 and 5), as has been conventionally performed using a variety of wave-guide based biosensor technologies such as Surface Plasmon Resonance Spectroscopy. Dr. Bornhop later expanded the application of BSI to the revolutionary study of free solution molecular interactions (6), and the age of BSI label-free and tether-free analysis of molecular interaction was born!
References
1. Refractive-index detection by interferometric backscatter in packed-capillary high-performance liquid chromatography. GO TO PUBMED>
2. A chip-scale universal detector for electrophoresis based on backscattering interferometry. GO TO PUBMED>
3. Attomole sensitivity for unlabeled proteins and polypeptides with on-chip capillary electrophoresis and universal detection
by interferometric backscatter. GO TO PUBMED>
4. Label-free molecular interaction determinations with nanoscale interferometry. GO TO PUBMED>
5. Photobiotin surface chemistry improves label-free interferometric sensing of biochemical interactions. GO TO PUBMED>
6. Free-solution, label-free molecular interactions studied by back-scattering interferometry. GO TO PUBMED>
Molecular Conformational Change
The molecular mechanism responsible for the BSI signal is changes in measured mean polarizability arising from molecular conformational change. Studies performed by MSI as well as the Bornhop Group at Vanderbilt University have confirmed this model.
Calmodulin Binding Study
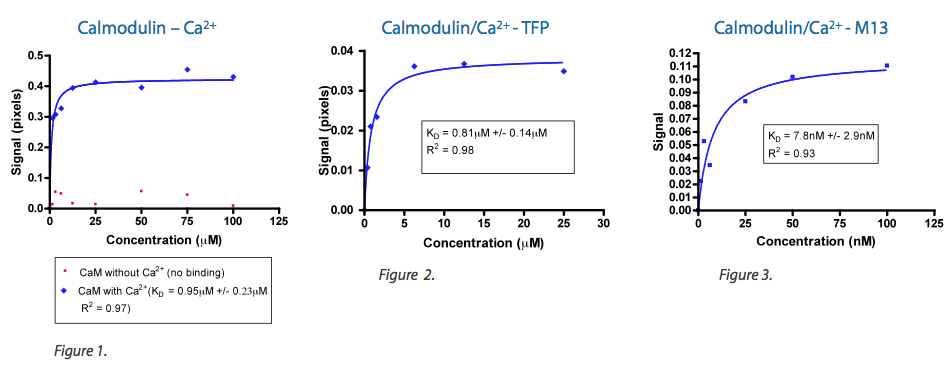
Work performed by MSI scientists have positively correlated observed BSI signal strength to ab initio modeling and empirical investigation for relative change in conformation for the apo- and holo-Calmodulin system. As shown in Figure 1, the interaction of Ca+2 with apo-Calmodulin to yield holo-Calmoldulin results in a measured BSI signal of approximately 400 millipiexels. When holo-Calmodulin was further challenged with a small molecule, Trifluoroperazine (TFP) (see Figure 2), or a large peptide, M13 (see Figure 3), measured signal strength positively correlated with previously reported change in conformation (1-4).
References:
1. Komeiji Y, Ueno Y, & Uebayasi M (2002) Molecular dynamics simulations revealed Ca(2+)-dependent conformational change of Calmodulin. FEBS letters 521(1-3):133-139.
2. Shen X, et al. (2008) The secondary structure of calcineurin regulatory region and conformational change induced by calcium/calmodulin binding. The Journal of biological chemistry 283(17):11407-11413.
3. Trajkovic S, Zhang X, Daunert S, & Cai Y (2011) Atomic force microscopy study of the conformational change in immobilized calmodulin. Langmuir : the ACS journal of surfaces and colloids 27(17):10793-10799.
4. Vandonselaar M, Hickie RA, Quail JW, & Delbaere LT (1994) Trifluoperazine-induced conformational change in Ca(2+)-calmodulin. Nature structural biology 1(11):795-801.
Bovine Serum Albumin pH Titration Study
BSA is a soft, globular protein that undergoes pH dependent conformational change. BSA molecular volume was studied by densimetry (Biophys J. 2006, 91(9), p 3397-3404). As shown in the accompanying figure (blue dots), at acidic pH, BSA exists in a compact conformer. As pH is increased to 4.8, BSA assumes a fully open conformation. Upon subsequent titration to pH 7, BSA assumes another conformation which is slightly smaller in molecular footprint when compared to its maximum size. As can be seen, BSI tracks these pH-dependent conformational changes (green squares), further substantiating the relationship between BSI signal and molecular conformation.
BSI tracks pH-dependent conformational changes of serum albumin consistent with molecular volume measurements from densimetry.(Biophys J 2006, 91(9) p3397-3404)
The BACE 1 Study
MSI scientists work with a client to study the interaction of various ligands to Beta Secretase 1 (BACE 1).
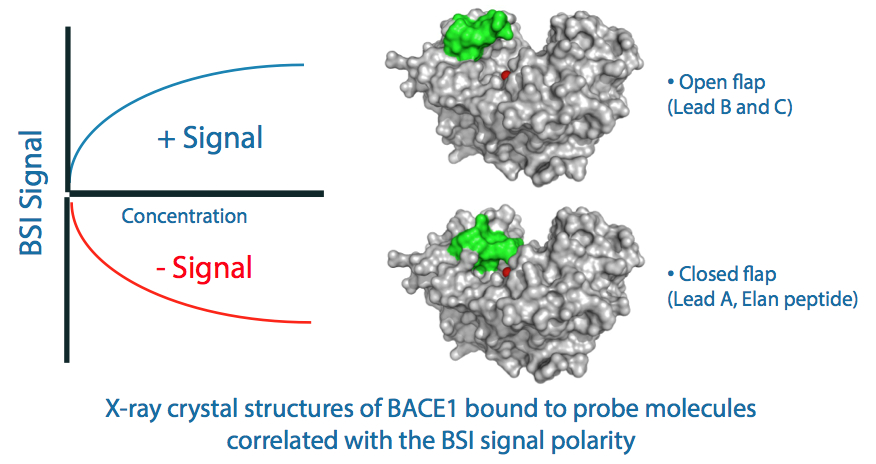
Three client lead compounds (A, B, and C) as well as the Elan peptide were studied for their binding behavior with BACE1. X-ray crystallographic data provided by the client indicated that a distal flap (green) differentially responded to ligand binding in the target site (red). For lead compounds B and C, the distal flap would open, thus increasing the radius of gyration and solvent addressable surface area of this enzyme. Conversely, binding of the Elan peptide and Lead A resulted in the contraction of the distal flap along with concomitant reduction in BACE footprint. BSI measurement of these interactions indicated a positive change in mean polarizability for those ligands which caused the flap to open and a negative change for those which closed the flap, further substantiating the ability to measure changes in protein conformation.
How BSI Works
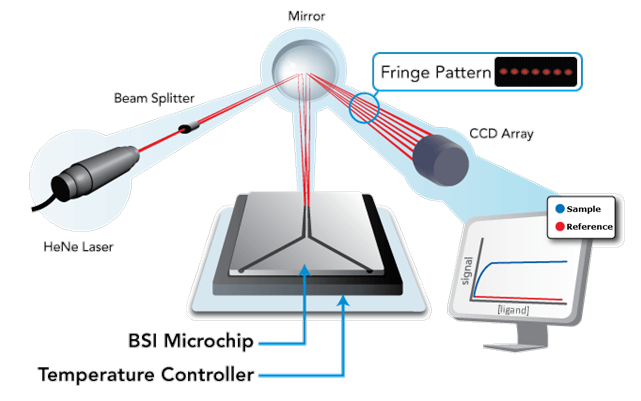
The Back-Scattering Interferometer
The Back-Scattering Interferometer is elegantly simple. The BSI device consists of a light source (HeNe laser), an object (the microchip), and a detector (CCD Array). At the heart of the system is the microchip. The microchip receives coherent light from a HeNe laser. Light impinges upon a channel. As light passes into the channel, combinations of reflection and refraction at the air-chip interfaces (front and back) as well as fluid-chip interfaces creates constructive and destructive interference fringe patterns in the back-scattered direction. These fringes are collected by a mirror and directed to strike a video camera (CCD array) that images the fringes as shown in Figure 1. Before light exits the chip, it reflects many, many times within the fluidic channel. As such, the channel functions as a resonance cavity, increasing the effective path-length of the measurement to millimeter scale. It is this resonance which provides BSI with its unrivaled label-free sensitivity. When molecules combine, the resultant complex causes a constitutive change in molecular mean polarizability that is measured in the detection zone as a phase shift in many of the frequencies that comprise the interference pattern. Monitoring the change in phase as a function of ligand concentration allows equilibrium Kd measurements to be performed on the BSI instrument even in complex biological or chemical matrices.
BSI Signal Processing
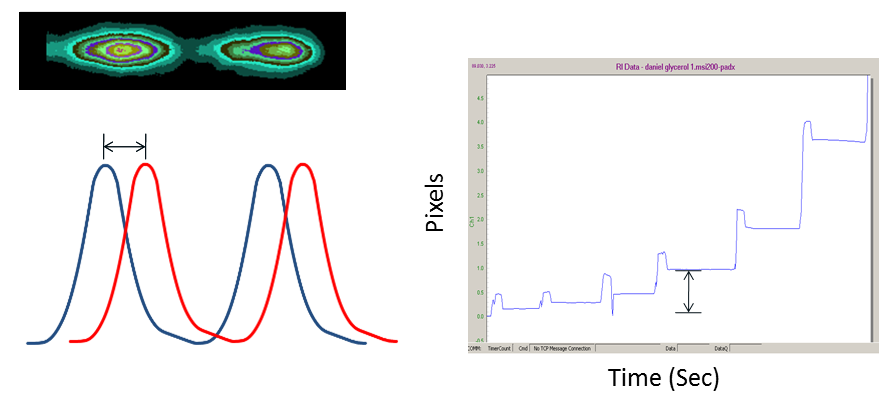
When molecular complexes form, they cause a measurable change in mean polarizability within the channel, which in turn causes the fringes to shift their position (move to the left or move to the right; see figure above). A proprietary algorithm is applied to determine minute changes in fringe position among the various frequencies which comprise the fringe array. The output of the system is a time dependent plot of fringe position that is translated into binding response.
The BSI chip is essentially a flow cell, in which previous samples are displaced with subsequent injections. Unlike many other bio-sensing techniques, with BSI there is no need for surface regeneration, as each measurement is truly performed in free solution. As illustrated in Figure 2, each sample injection-read cycle is completed in about 30 seconds. The amplitude of these plots is related to abundance of the binding complex, enabling end-point, equilibrium dissociation constant determination.
Setting up the BSI Assay
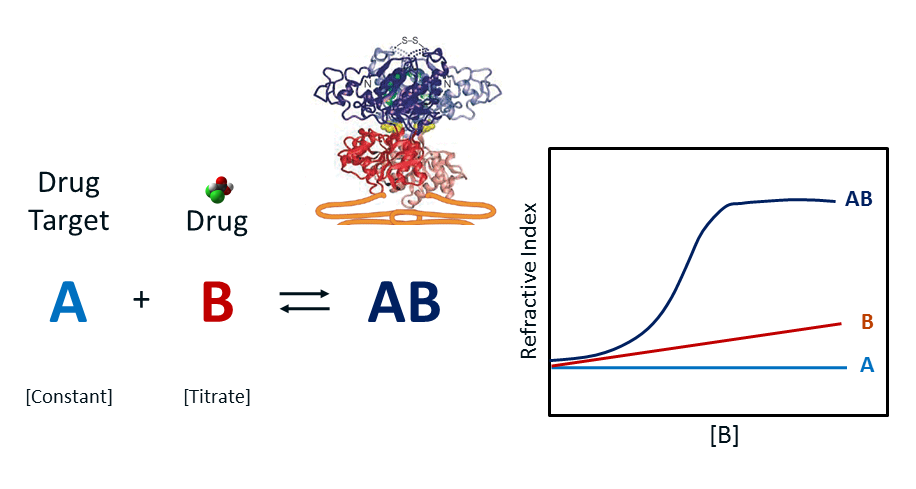
Free solution BSI Kd determinations are performed in end-point fashion, with target and ligand pre-incubated to establish equilibrium. Target and ligand concentrations are established to initiate pseudo-first order binding conditions, for which the target is typically held at sparing concentration and the ligand in excess to insure against depletion during the binding process.
The concentration of target can range from pM to uM depending on the Kd of the ligand – target equilibrium. A series of range-finding experiments are launched to establish the optimal concentration of the target, which is ideally established to be about one-tenth of the system’s Kd. Usually, the analyte concentration ranges from one-fifth to 10 times the concentration of the system Kd. The figure above illustrates the RI change for a constant target A (light blue trace, constant RI), the increase in RI as ligand B is increased (red trace) as a control and finally, the hyperbolic binding isotherm RI curve for the equilibrium AB complex after mixing and equilibration of A and B (dark blue trace). In practice, control B is run simultaneously in a reference channel with complex AB run in the analytical channel. The difference is plotted as AB-B against an offset of A. A single site binding isotherm model is fitted to the AB curve to determine the binding maximum or Bmax. Kd is then established as ½ Bmax.